
Quick Start#
ploomber-engine is a toolbox for executing notebooks.
It provides enhanced capabilities such as debugging, profiling and experiment tracking.
A presentation showing features and use can be watched here, from JupyterCon 2023.
Installation#
pip install -U ploomber-engine
or
conda install ploomber-engine -c conda-forge
Run notebook#
Tip
There is a command-line interface available. Run: ploomber-engine --help to learn more.
Let’s download a sample notebook.
%%bash
curl https://raw.githubusercontent.com/ploomber/ploomber-engine/main/examples/display.ipynb --output nb.ipynb
% Total % Received % Xferd Average Speed Time Time Time Current
Dload Upload Total Spent Left Speed
  0     0    0     0    0     0      0      0 --:--:-- --:--:-- --:--:--     0
100  2672  100  2672    0     0  17999      0 --:--:-- --:--:-- --:--:-- 18054
from ploomber_engine import execute_notebook

_ = execute_notebook("nb.ipynb", "output.ipynb", parameters=dict(x=1, y=2))
Show code cell output
0%| | 0/11 [00:00<?, ?it/s]
Executing cell: 1: 0%| | 0/11 [00:00<?, ?it/s]
Executing cell: 2: 0%| | 0/11 [00:00<?, ?it/s]
Executing cell: 2: 27%|██████▊ | 3/11 [00:00<00:00, 13.47it/s]
Executing cell: 3: 27%|██████▊ | 3/11 [00:00<00:00, 13.47it/s]
Executing cell: 4: 27%|██████▊ | 3/11 [00:00<00:00, 13.47it/s]
sending something to standard error

Executing cell: 5:  27%|██████▊                  | 3/11 [00:00<00:00, 13.47it/s]
Executing cell: 5: 55%|█████████████▋ | 6/11 [00:00<00:00, 16.62it/s]
Executing cell: 6: 55%|█████████████▋ | 6/11 [00:00<00:00, 16.62it/s]
Executing cell: 7: 55%|█████████████▋ | 6/11 [00:00<00:00, 16.62it/s]
Executing cell: 7: 73%|██████████████████▏ | 8/11 [00:00<00:00, 14.39it/s]
Executing cell: 8: 73%|██████████████████▏ | 8/11 [00:00<00:00, 14.39it/s]
Executing cell: 9: 73%|██████████████████▏ | 8/11 [00:00<00:00, 14.39it/s]
Executing cell: 10: 73%|█████████████████▍ | 8/11 [00:00<00:00, 14.39it/s]
Executing cell: 10: 100%|███████████████████████| 11/11 [00:00<00:00, 19.80it/s]
Log print statements#
_ = execute_notebook("nb.ipynb", "output.ipynb", log_output=True, progress_bar=False)
sending something to standard error
some message
showing our logo :)
Plot cell’s runtime#
Note
Runtime profiling requires extra dependencies: pip install matplotlib
_ = execute_notebook(
    "nb.ipynb", "output.ipynb", profile_runtime=True, progress_bar=False
)
sending something to standard error
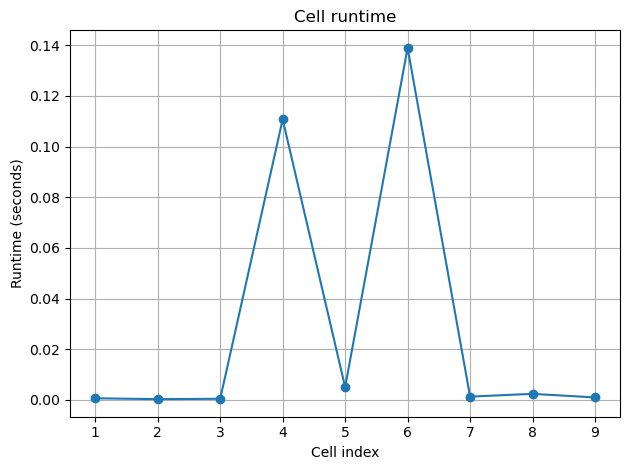
ls output-*
output-runtime.png
Plot cell’s memory usage#
Note
Memory profiling requires extra dependencies: pip install matplotlib psutil
_ = execute_notebook(
    "nb.ipynb", "output.ipynb", profile_memory=True, progress_bar=False
)
sending something to standard error
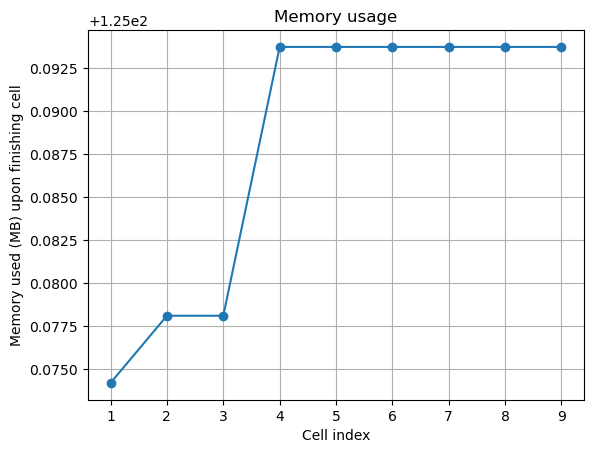
ls output-*
output-memory-usage.png output-runtime.png